
John Williams: The Real Unemployment Rate: 22% – Not 8.1% - The coming fiscal cliff: hyperinflation on track for 2014 - Lew Rockwell.com - James J. Puplava - May 16, 2012 - JIM: Joining me on the program today is John Williams of Shadow Government Statistics. And John, before we get into a real big issue that’s going to hit the economy January 2013, I want to talk about the front page of your website. And you have two graphs that are available publicly and one is the unemployment rate where you have U3, U6 and then SGS, which is your own. Let’s talk about those numbers, what they mean for our listeners and the differences between them. [1:11]
JOHN: Sure. I’ve been a consulting economist for 30 years. What I’ve found over the decades is that the government’s reporting has moved further and further away from common experience, and really, the average guy has got a pretty good sense of what’s going on. If you feel the economy is not as strong as the government is saying or that inflation might be higher than what they’re reporting, you’re most likely right because you’re dealing with the real world. The numbers use to deal much closer to real world experience. And with the unemployment number, if you, let’s say, went around the entire country and asked everyone whether he or she was unemployed, you’d get an immediate answer. Most people have a pretty strong opinion as to what’s up, they have a job; they know what’s going on. But if you put all those numbers together, you’d come up with a much higher unemployment rate than the government reports, or at least the headline government number to date. So that’s all due to definition. In order to be counted in the headline unemployment rate – and keep in mind, the government actually publishes six levels of unemployment. The third level they call U3 is the headline number – you have to obviously be out of work and willing and able to take a job, but you have to have actively looked for work in the last four weeks. There are people who’ve stopped looking for work after a period of time when there are just no jobs to be had, yet they’d take a job if it were available, and they otherwise consider themselves unemployed. They want a job; they are willing and able to work. And again, they’d take it as soon as it was offered. If you haven't been looking in the last four weeks, the government will count you as a discouraged worker so long as you've looked for work in the last year. If you haven't actively looked for work in the last year, they don’t count you at all. Before 1994, anybody who was a discouraged worker, irrespective of the period of time, was counted as a discouraged worker. So that where you have the U3 unemployment rate at, I believe it’s 8.2% in March, the government’s broadest number U6 (which includes what I call the short term discouraged workers, those who have given up looking for work, but not for more than a year) and also includes people who work part-time for economic reasons (they can’t get a full-time job, they want a full-time job but you know, no full-time job is available) that’s running up somewhat over 14%. And what I do is I add to that my estimate of the longer term discouraged workers – those who have been discouraged more than a year. That puts you up over 22%. What happens here is the people who are unemployed roll out of the U3 level; they become discouraged because there are no jobs to be had, and so they go into the U6 level. And after a year, they roll out of the U6 level in terms of going into another world that the government does not count. I still estimate them, so my number is broader than the government’s number. So when you see the unemployment rate dropping, yet the broader measures are rising or staying at near historic levels, you do not have an economic recovery and that’s what we’re showing. [4:26]
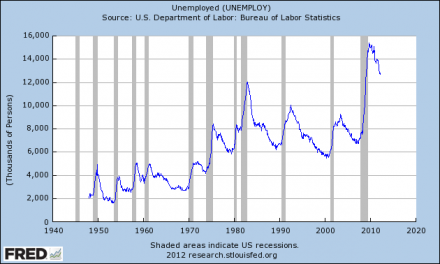
There Are 100 Million Working Age Americans That Do Not Have Jobs - The Economic Collapse Blog - The unemployment crisis in America is much worse than you are being told. Did you know that there are 100 million working age Americans that do not get up in the morning and go to work? No wonder why it seems like there are so many people that do not have jobs! According to the federal government, there are 12.6 million working age Americans that are considered to be "officially" unemployed, but there are another 87.8 million working age Americans that are not working either. The federal government considers those Americans to be "not in the labor force" so they are not included in the unemployment rate. In fact, this is one of the key ways that the government manipulates the unemployment numbers. The Obama administration would have us believe that the unemployment rate is going down and that that since the start of the last recession about as many Americans have left the labor force as we saw during the entire decades of the 1980s and 1990s combined. Of course that is a bunch of nonsense, but that is what the Obama administration would have us believe. The truth is that the percentage of working age Americans that are employed is just about the same right now as it was two years ago. It was incredibly difficult to get a job back then and it is incredibly difficult to get a job right now. So don't believe the hype that things are getting much better. If you still do have a good job, you might want to hold on to it tightly, because there is not much hope that things are going to improve significantly any time soon. The first chart that I have posted below shows the total number of "officially" unemployed workers in America. According to the Federal Reserve, that number is currently 12,673,000. This chart makes it look like the employment picture in America is getting significantly better....
But if you dig deeper into the numbers you quickly see that this is not true. A lot of those workers that were formerly classified as "unemployed" have now been moved into the "not in labor force" category. Since the start of the last recession, the number of Americans not in the labor force has risen by more than 8 million according to the Obama administration. The total number of working age Americans not in the labor force now stands at 87,897,000....
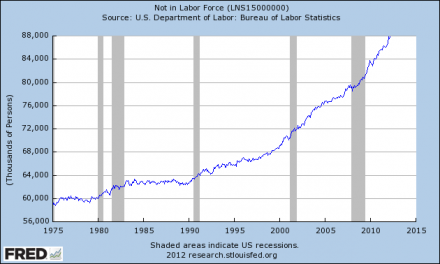
So when you add 12,673,000 and 87,897,000, you get a total of 100,570,000 working age Americans that do not have jobs. Yes, there are certainly millions upon millions of working age Americans that do not have jobs and that do not want jobs. But you have to be delusional to believe that there are nearly 88 million working age Americans that do not have jobs and that do not want jobs.
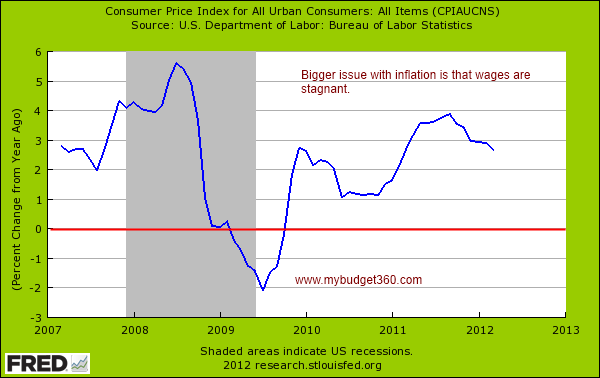
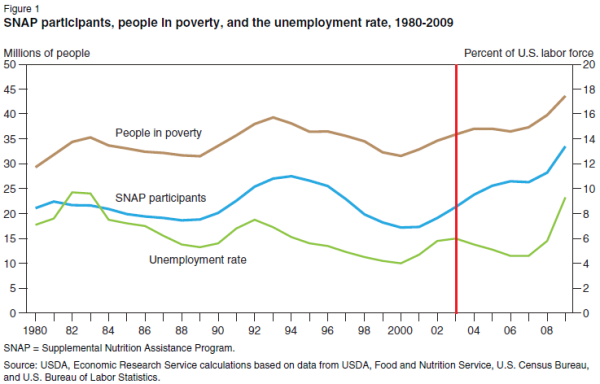
The wrecking ball of hidden inflation and Fed based strategies – food inflation far outpacing overall inflation and eating away at the purchasing power of 46,000,000 Americans on food stamps. - My Budget 360.com - The Federal Reserve has openly called for a steady growth of inflation. This almost dogmatic view on inflation is problematic because it is detached to the lack of wage growth being experienced by working and middle class families. What you do not hear articulated from the Fed is that they would like to encourage wage inflation as well. The inflation growth is really a shadow bailout of the banking sector in our economy that still requires billions and billions of dollars for horrible bets and poorly placed gambles. If the beat of inflation marches on, these debts can be washed away simply because purchasing power is lost moving forward. Yet this is bad policy for the vast majority of Americans. Inflation has crept into the daily lives of Americans because of this policy. Food prices have increased steadily while energy remains expensive. The cost to go to college still continues to increase in spite of a bubble in student debt. Inflation is a double-edged sword and the Fed is aggressively pursuing this option largely to aid their banking allies.
Inflation is already here for working and middle class Americans
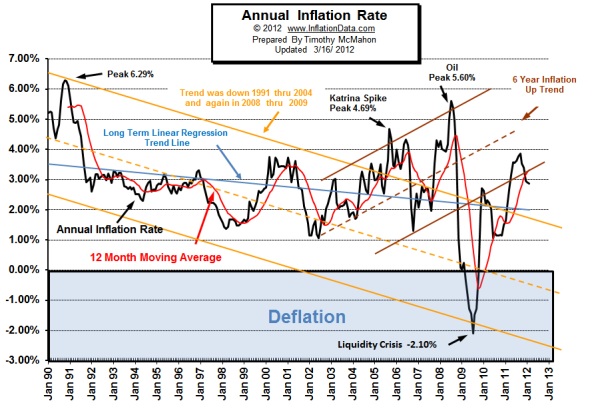
Inflation is already hitting the wallets of most Americans. - After the liquidity crisis and trillions of dollars infused into the system, inflation is now on an upward march:
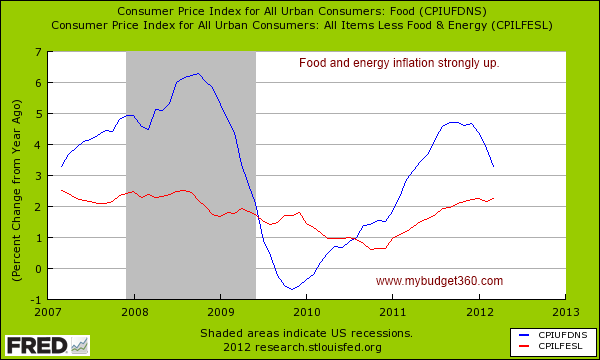
Since 2010 the inflation rate in food has far outpaced the rate of inflation overall. With so many Americans struggling to get by this is being felt in many ways on a daily basis. Anyone shopping at the store realizes how much more expensive food items have become. You also see disinflation where you pay the same price but get less because of creative packaging:
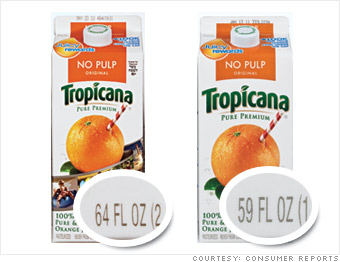
“(Country Consultant) Tropicana orange juice: 64 oz. container is now 59 oz. – a 7.8 percent reduction.
Ivory dish detergent: 30 oz. bottle is now 24 oz. – 20 percent reduction
Kraft American cheese: 24 slice package now holds 22 slices – 8.3 percent reduction
Scott toilet tissue: 115.2 sq. ft. now 104.8 sq. ft. – 9 percent reduction
Chicken of the Sea salmon: 3 oz. can now 2.6 oz. – 13.3 percent reduction”
JPMorgan’s Trading Loss Is Said to Rise at Least 50% - Dealbook.com - NELSON D. SCHWARTZ and JESSICA SILVER-GREENBERG - May 16, 2012 - The trading losses suffered by JPMorgan Chase have surged in recent days, surpassing the bank’s initial $2 billion estimate by at least $1 billion, according to people with knowledge of the losses. When Jamie Dimon, JPMorgan’s chief executive, announced the losses last Thursday, he indicated they could double within the next few quarters. But that process has been compressed into four trading days as hedge funds and other investors take advantage of JPMorgan’s distress, fueling faster deterioration in the underlying credit market positions held by the bank. A spokeswoman for the bank declined to comment, although Mr. Dimon has said the total paper trading losses will be volatile depending on day-to-day market fluctuations.
JPMorgan unit has $100bn of risky bonds - Financial Times of London - Sam Jones in London and Tracy Alloway and Tom Braithwaite in New York - May 18, 2012 - The unit at the centre of JPMorgan Chase’s $2bn trading loss has built up positions totalling more than $100bn in asset-backed securities and structured products – the complex, risky bonds at the centre of the financial crisis in 2008. These holdings are in addition to those in credit derivatives which led to the losses and have mired the bank in regulatory investigations and criticism. The unit, the chief investment office (CIO), has been the biggest buyer of European mortgage-backed bonds and other complex debt securities such as collateralised loan obligations in all markets for three years, more than a dozen senior traders and credit experts have told the Financial Times. The bank has said its derivative activities were intended primarily to help balance risks on its overall balance sheet, but the revelation that it has built up other large, risky positions is likely to raise further questions about the CIO’s remit.
The Obama Economy Is Wrecking NASCAR - According to a new study - The Weekly Standard - Michael Warren - May 15, 2012 - The National Association for Stock Car Auto Racing (NASCAR) has been considered America’s fastest growing sport, quickly becoming a national phenomenon. But a new economic study shows even NASCAR’s powerful engines haven’t been able to keep up with the Obama-era economy. The study, from the pro-market think tank Public Notice and Race Fans 4 Freedom, finds that the economic downturn of the last several years has directly affected how NASCAR fans watch and enjoy their sport. Since 2009, race attendance per year has fallen below 4 million people, and the number has been declining severely as the unemployment rate has skyrocketed. The cost of attending—with higher gas prices, less disposable income, and diminished financial security—has increased. According to the study, the value of the sport, too, is threatened by the poor economy, with the stock prices of racing team companies plummeting in the last five years and sponsors pulling back on funding cars.
Paul Krugman admits to the Depression - He is a Democrat Party extremist, but the message is clear that we aren't in a recovery. We are in a Depression. He sloshes through the interview with Democrat Dogma and ideology, but his viewpoint is worthwhile. Krugman is quick to cut Obama slack and call Republicans liars and. Folks, we have to meet somewhere in the middle. Say no to Austerity. Say no to Cronyism. Say yes to targeted spending on infrastructure and human capital and rein in "Free for All" trade and the Gambleholic Banksters.